Estimated reading time: 7 minutes
Markets move in patterns that repeat over time. These patterns are known as market cycle phases. To clarify, they show how markets rise, reach a peak, fall, and eventually recover. You see these phases in many parts of the economy. In addition, you see them in different types of investments. Because of this, understanding market cycles helps you make sense of changes in prices and activity.
Market cycles appear in many forms. Some cycles move quickly. Whereas, others take years to unfold. Yet the basic idea stays the same. Markets shift from confidence to caution and then back again. These shifts influence prices and shape how different investments perform. As a result, the phases of a market cycle help explain why some assets do well in certain periods while others slow down.
Different sources use different names for these phases. Economists use one set of terms. While, technical analysts use another. Both systems describe the same pattern. They simply focus on different parts of the cycle. This guide explains both naming systems. Furthermore, it shows how they connect. As a result, you get a clear and simple way to understand market cycle phases without adding complexity.
Market cycles also help you see market trends over time. These trends show how markets respond to changes in confidence, earnings, and expectations. In addition, they show how cycles repeat, even when the timing changes. With this in mind, the next sections walk through each phase and explain how the two naming systems fit together.
Table of contents
What Are Market Cycles?
Market cycles describe the way markets move through repeating patterns over time. These market cycle phases show how prices rise, reach a peak, fall, and then recover. You see these patterns in many parts of the economy and across different types of investments. Because of this, understanding market cycles helps you see how prices react when confidence rises or weakens.
Markets move through cycles as conditions change. Earnings rise or slow. Then, expectations adjust as new information appears. As these forces build, markets move from one phase to the next. As a result, this movement creates a rhythm that repeats, even when the timing is different from one cycle to another. These patterns also help you see market trends over time without focusing on short term movements.
Different sources describe these phases in different ways. Economists use one set of terms. Technical analysts use another. Both systems describe the same pattern. They simply focus on different parts of the cycle. This guide explains both naming systems and shows how they connect. As a result, you get a clear view of the phases of a market cycle in a simple and structured way.
Why Market Cycles Happen
Market cycles happen because conditions in the economy and financial markets keep changing. Therefore, activity grows, slows, and then grows again. Company earnings rise or weaken. Expectations shift as new information appears. These changes influence prices and push markets from one phase to the next. As a result, market cycle phases repeat over time, even when the timing is different in each cycle.
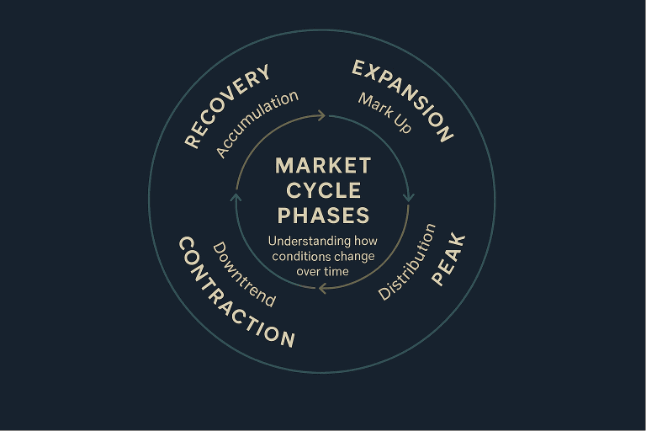
The Four Market Cycle Phases
Market cycles move through four broad phases. Economists describe them through changes in activity and earnings. While, technical analysts focus on price behaviour and sentiment. Overall, when you look at both systems together, you see the same pattern from two different angles.
Economic Terms
Recovery — Conditions stabilise after a downturn and activity stops weakening. In addition, confidence begins to improve, and expectations shift as early signs of progress appear. As a result, prices may start to move higher as the cycle turns upward.
Expansion — Activity grows at a steady pace and earnings strengthen. Confidence rises as more positive information comes through. Therefore, prices often trend higher because demand increases across many parts of the market.
Peak — Activity reaches its strongest point and confidence remains high. However, momentum starts to slow. As a reult, prices may rise more gradually as expectations become mixed and investors reassess the outlook.
Contraction — Activity slows and earnings weaken. Confidence falls as caution builds. Therefore, prices typically decline until conditions stabilise and the cycle moves back toward recovery.
Technical Terms
Accumulation — Prices often move sideways after a decline as selling eases. Long term investors may begin buying because conditions stop worsening. As a result, they may see opportunity to buy undervalued assets. This phase often develops before the wider market recognises the shift, which can create early opportunities.
Mark Up — Prices generally start rising as demand increases. More investors typically notice the trend, optimism grows, and trading volumes often rise. Accordingly, this phase usually becomes the most profitable because confidence and participation build together.
Distribution — Prices remain high but often start to flatten. Sentiment turns more cautious, and early investors may begin selling to lock in profits. , Consequently, this phase typically signals a transition from a strong upward trend to a weaker one.
Downtrend (Mark Down) — Prices generally decline as sentiment turns pessimistic. As a result, selling often accelerates and markets may experience periods of panic selling. This phase usually continues until prices fall to levels that attract long term investors again. Therefore, sets the stage for a new accumulation phase.
How the Two Naming Systems Connect
Both systems track the same pattern, just from different angles. The economic view tracks changes in activity and earnings. While, the technical view shows how buyers and sellers respond to those changes. When you place them together, the alignment becomes clear:
- Recovery ↔ Accumulation — Conditions stabilise and early buyers often return, seeking opprtunity to buy at lower prices before wider market notice the shift..
- Expansion ↔ Mark Up — Activity grows and prices typically rise as demand increases. Therefore usually most profitable stage.
- Peak ↔ Distribution — Activity reaches its strongest point and prices often level off. Sentiment turns more cautious, and early investors may begin selling to lock in profits.
- Contraction ↔ Downtrend — Activity slows and prices generally decline as sentiment weakens. As a result, selling often accelerates and markets may experience periods of panic selling. This phase usually continues until prices drop to levels that attract long term investors, setting up the next accumulation phase.
Understanding both systems gives you a clearer view of how cycles shape market trends over time and how each phase fits into the broader pattern.
Why Market Cycles Matter for Investors
Market cycles matter because they show how conditions change over time. Each phase reflects a different mix of confidence, activity, and expectations. As a result, these shifts shape how prices move and how investors react to new information.
As the cycle moves from one phase to the next, you can see when conditions strengthen or weaken. Activity may rise in one phase and slow in the next. In addition, prices often adjust before the broader economy does. These shifts can create moments when buyers step in early or when sellers choose to lock in gains as conditions change.
Market cycle phases also link directly to market trends over time. Therefore, a trend may rise across several phases, flatten near a peak, or weaken during a downturn. When you understand how each phase develops, you can better see where potential buying or selling opportunities may appear as conditions evolve.
Conclusion – Bringing It All Together
Market cycles move through repeating phases as conditions change, and each phase sets up the one that follows. Economic and technical terms describe the same sequence from different angles. Yet, both highlight the same turning points. Therefore, when you follow how each phase develops, you gain a clearer view of long term market trends. Furthermore, how markets respond as confidence, activity, and expectations shift.
Quick Summary
- Market cycles move through repeating phases as conditions change.
- Each phase shapes how prices behave and how investors respond.
- Prices often adjust before the broader economy.
- Market cycle phases help explain market trends over time.
- Shifts between phases can create moments when buyers step in early or sellers lock in gains.
Recent Articles on Market Concepts
-

Asset Allocation: How to Build a Balanced Investment Mix
Asset allocation is the way you divide your money across…
-

How Diversification Reduces Risk in Investing
Diversification helps investors manage uncertainty by spreading exposure across different…
-

Risk vs Return: Understanding the Trade Off in Investing
Understanding risk vs return is one of the first steps…

Explore More Investing Resources And Tools
Use calculators and downloadable tools, such as our ratio analysis spreadsheet to apply what you learn.
Market Concepts – Tools to Download and Online Calculators
Market Concepts – Recent and Most Read Articles and Guides
Disclaimer – Educational Use Only
Content on MoneyOpes.com is for informational and educational purposes only. It does not constitute financial, legal, or professional advice. Your financial situation is unique, and outcomes may differ. Past performance is not a guarantee of future results. MoneyOpes.com adheres to strict editorial integrity standards, and to the best of our knowledge, all content is accurate as of the date posted. See our full disclaimer.