Estimated reading time: 16 minutes
Understanding risk vs return is one of the first steps in learning how investing works. Every investment offers the chance to earn a return. In addition, it also carries some level of risk. As a result, this balance between risk and reward shapes almost every financial choice you make.
Different saving and investing products come with different levels of risk and return. Some let you access your money quickly. Others grow your money at different speeds. While, some focus more on safety. Therefore, differences help you compare your options and understand what each product may offer [1] .
As you explore these choices, you start to see how the risk and return relationship guides your decisions. Some investments aim for steady results. However, others aim for higher rewards but come with more uncertainty. This risk return trade off also supports diversification and long term planning.
Many new investors also want to know what the best risk to reward ratio looks like. The answer depends on your goals and your time horizon. Even so, learning how ratios work can help you compare choices. In addition, it can help you understand what a good risk reward ratio might look like for your situation.
This guide explains these ideas in simple terms. It shows how risk and return work together. It also offers clear examples so you can build confidence as you learn more about investing.
Quick Navigation
What Risk and Return Mean
Risk and return work together in every investment. Return shows what you gain or lose when the value of your investment changes. In addition, it includes any income you receive, such as interest or dividends. While, risk shows the chance that the result will be different from what you expected. These ideas help you compare different saving and investing products. Moreover, they help you see how each choice may support your goals.
Different investments offer different levels of risk and return. Some grow slowly and focus on stability. However, others grow faster but may also fall in value more often. Because of these risk vs return differences, many investors choose a mix of products rather than relying on only one. [2]
As you explore these choices, you start to see how the relationship between risk and return guides your decisions. Some investments aim for steady results. While, others aim for higher rewards but come with more uncertainty. This balance also prepares you for later ideas such as diversification and asset allocation.
You can also explore your own comfort with risk by taking the Investor Personality Test. Each answer maps to one of four investor types and shows how risk and time horizon shape your choices. This gives you a clear starting point for further learning.
What Risk Means
Risk shows the chance that an investment will give a result that is different from what you expected. It can mean the value may rise or fall. It can also mean you may not reach your goals if the investment does not perform as planned. Therefore, because every investment carries some uncertainty, you learn to look at how often its value may change and how quickly those changes may happen.
As you explore different investments, you start to see clear patterns. Some choices move up and down more often. While, others move more slowly and feel more stable. These differences help you understand why some investments feel safer while others feel more unpredictable. In addition, they help you see how your comfort level shapes your long term decisions.
This section keeps the idea simple. Later sections will explain the different types of risk, how markets move, and how your own situation affects how much risk you can take.
What Return Means
Return shows how much your investment has gained or lost over time. These include, changes in value and any income you receive, such as interest or dividends. Therefore, because return helps you measure progress toward your goals, it becomes one of the first things you look at when comparing investments.
As you review different choices, you notice that some investments grow slowly but steadily. While, others grow faster but may also fall in value more often. As a result, these differences help you compare your options and understand what each one may offer. In addition, they prepare you for later ideas such as total return, percent return, and real return.
This section keeps the explanation brief. However, later sections will explore how to measure return, how inflation affects your results, and how taxes can change what you keep.
The Risk Return Trade Off
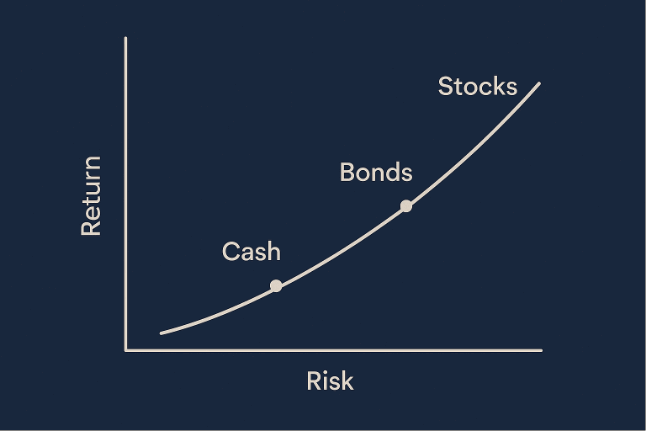
The risk return trade off explains how the level of risk you take connects to the results you may receive. Higher risk investments can rise or fall more sharply, yet they also offer the chance for stronger long term growth. While, lower risk choices tend to move more slowly and focus on stability, but they usually offer smaller returns. This balance shapes many investment decisions. In addition, it helps you match your choices to your goals and your time horizon.
Why risk and reward move together
All investments carry some chance of loss. When you buy stocks, bonds, mutual funds, or ETFs, you accept the possibility that you could lose some or all of the money you invest. [3] The potential reward for taking on this uncertainty is the chance for higher returns over time. When your goals are far away, you may choose investments that carry more risk because you have more time to recover from downturns. However, when your goals are close, you may prefer safer choices that protect your savings even if they grow more slowly.
How your time horizon shapes the trade off

Your time horizon plays a major role in how much risk you can take. Therefore, when you have many years before you need the money, you may choose investments that move up and down more often because they offer more growth potential. However, when you need the money soon, you may shift toward lower risk options that focus on stability. This change helps you protect your savings as you get closer to using them.
How risk tolerance fits into the trade off
Your comfort with risk also affects how you approach this balance. An aggressive investor accepts more ups and downs to aim for higher long term results. On the other hand, a conservative investor prefers choices that protect the original amount invested, even if the returns are smaller. Many people fall somewhere in the middle. For this reason, understanding your own comfort level becomes an important part of choosing investments that fit your situation.
Why the trade off matters for your decisions
Understanding the risk return trade off helps you choose investments that fit your goals, your time horizon, and your comfort level. In addition, it prepares you for later ideas such as diversification and asset allocation, where you combine different types of investments to balance growth and stability.
Understanding Return
Return shows how much your investment has gained or lost over time. Simply put, it includes changes in value and any income you receive, such as interest or dividends. Because return helps you measure progress toward your goals, it becomes one of the first things you compare when you look at the risk vs return relationship. [2] As you compare investments, you see how each one affects your risk vs return balance. Some add stability. While, others add growth. These differences shape the choices you make over time.
Total Return
Total return shows the full change in your investment. It includes the increase or decrease in value and any income you receive. Therefore, this gives you a clearer picture than looking at price changes alone. When an investment grows in value and also pays income, both parts work together to build your total return. As a result, total return helps you compare investments that behave differently and see which ones support your goals more effectively.
Percent Return
Percent return shows your gain or loss as a percentage of what you invested. Therefore, making it easier to compare investments that you bought at different prices. In addition, it helps you see which choices improved your results and which ones slowed your progress. As you compare percent returns across your portfolio, you begin to understand which investments offer the best risk to reward ratio for your situation.
Annualized Return
Annualized return shows how much an investment grew on average each year. Therefore, it lets you compare investments you held for different lengths of time. This matters because most people invest at different moments and keep each investment for a different period. When you use annualized return, you can see whether an investment is growing fast enough to support your long term goals. As a reult, it gives you one clear measure you can use across your whole portfolio.
Real Return
Real return shows how much your investment grows after adjusting for inflation. Inflation reduces the buying power of your money, so your actual progress may be smaller than the number you first see. Therefore, real return gives you a clearer view of what your investment truly earned.
Inflation can change the picture quickly. Imagine your investment earns 7% in a year when inflation is 4%. Your real return is 3%. Your account balance grew, but your buying power grew by a smaller amount. Therefore, the higher your real return, the more your money can do for you over time.
Real return also shows why very conservative investments may not support long term goals. Many low risk choices grow more slowly than inflation. For example, a savings product that pays 1.2% in a year when inflation is 2% gives you a real return of negative 0.8%. Your balance rises, but your buying power falls. This gap can widen over many years and may leave you short of your goals.
Real return helps you compare investments in a more meaningful way. In addition, it helps you understand why growth plays an important role in long term planning, even when you prefer stability.
How Timing Affects Return
The timing of when you buy and sell can affect your return. Buying before a price increase leads to stronger results. However, buying after a price has already risen may lead to smaller gains. This is one reason your personal results may differ from the returns reported for a fund or index. Timing also matters when you invest regularly. Prices change over time, so your returns may differ from someone who invested all at once.
How Taxes Affect Return
Taxes reduce the amount you keep from your investment gains and income. This means your after‑tax return may be lower than your total return. However, because tax rules differ across countries, the impact varies for each investor. Even with these differences, the idea remains simple. Taxes reduce what you keep, so your actual progress may be smaller than the headline return.
Understanding Risk
Risk shows the chance that an investment may give a result that is different from what you expected. In finance, risk means uncertainty and the possibility of losing some or all of the money you invest. [4] Because every investment carries some level of risk, understanding how risk works helps you compare choices and see how each one fits into your risk vs return balance.
Risk also varies across different investments. Some move slowly and focus on stability. While, others move more quickly and offer more growth potential. These differences shape the best risk to reward ratio for your goals and your time horizon. Therefore, as you learn more about risk, you start to see how each type affects your long term results. [2]
Nonsystemic Risk
Nonsystemic risk comes from individual investments. It includes business risk, management risk, and the risk of concentrating too much money in one company. A company may face unexpected problems, make poor decisions, or even fail. As a result, the value of its stock or bonds may fall sharply.
You can reduce nonsystemic risk by spreading your money across different investments. This approach, known as diversification, helps offset losses in one investment with gains or stability in others. Therefore, diversification plays an important role in managing risk.
Systemic Risk
Systemic risk affects the entire market. You cannot avoid it, even with a diversified portfolio. For instance, market downturns, global events, and economic shocks can all cause broad declines. As a result, many investments may fall at the same time.
Even though you cannot remove systemic risk, you can prepare for it. A clear plan, a balanced mix of investments, and an understanding of your own comfort level help you stay focused during periods of uncertainty.
Market Risk
Market risk is the chance that the overall market will fall in value. When markets drop, many investments decline together. Because of this, stocks and stock funds often fall during these periods, and some companies may not recover. However, the greater dange canr come from selling during a downturn, which can lock in losses.
Market risk affects short term results more than long term results. Therefore, over longer periods, markets have historically recovered and grown, although the timing of each recovery varies.
Interest Rate Risk
Interest rate risk affects bonds and other fixed income investments. When interest rates rise, existing bonds often lose value because new bonds offer higher rates. Rising rates can also influence stock prices, as some investors shift toward interest‑paying investments.
Interest rate changes can influence your portfolio in different ways. Therefore, many investors use a mix of investments to balance growth and stability.
Recession Risk
Recession risk appears when the economy slows. During a recession, many investments may lose value. For instance, companies may earn less, consumers may spend less, and markets may react to the uncertainty. Therefore, these periods can feel uncomfortable, but they are a normal part of economic cycles.
Political Risk
Political events can affect both domestic and international investments. As a result, changes in policy, elections, or periods of instability can influence market confidence. Political stability often supports growth, while uncertainty may cause prices to fall.
Volatility
Volatility shows how often and how sharply an investment’s price moves. Some investments, such as stocks, change price more quickly. Whereas, others, such as many bonds, move more slowly. Even within the same category, volatility varies. For example, large, established companies often move more slowly than smaller or newer companies.
Volatility affects short term results the most. However, over longer periods, the ups and downs often even out. Therefore, a diversified portfolio may fall during a downturn, but it also has the potential to recover and grow over time.
Risk Tolerance
Risk tolerance shows how comfortable you feel with uncertainty. Some people accept more ups and downs to aim for higher long term growth. However, others prefer stability, even if returns are smaller. Your age, goals, financial responsibilities, and personality all influence your comfort level.
Risk tolerance also changes over time. When you have many years before you need the money, you may accept more risk. However, when you are closer to using your savings, you may prefer more stable choices. Therefore, understanding your own comfort level helps you choose investments that fit your situation.
Glossary: Risk vs Return
- Risk vs Return
- Risk vs return describes how much uncertainty you accept in exchange for potential growth. Higher returns usually come with more ups and downs, while lower-risk choices tend to grow more slowly.
- Risk to Reward Ratio
- The risk to reward ratio compares the potential return of an investment with the level of risk you take. It helps you judge whether an investment offers enough growth for the uncertainty involved.
- Volatility
- Volatility shows how often and how sharply an investment’s price moves. More volatile investments rise and fall quickly, while less volatile ones move more slowly.
- Nonsystemic Risk
- Nonsystemic risk comes from a single company or investment. You can reduce it by diversifying across different assets so one setback does not affect your entire portfolio.
- Systemic Risk
- Systemic risk affects the entire market. It cannot be avoided, even with diversification, because broad events can cause many investments to move together.
- Diversification
- Diversification spreads your money across different investments. This reduces the impact of any single loss and helps create a more stable long-term path.
- Time Horizon
- Your time horizon is the length of time before you expect to use your money. It shapes how much risk you can take and how much movement you can accept in your portfolio.
Conclusion
Risk and return work together in every investment. Return shows how your money grows. Risk shows how much uncertainty you accept to reach that growth. Therefore, as you compare different investments, you see how each one fits into your own risk vs return balance. Some choices focus on stability. Whereas, others offer more growth. Finally, each one plays a different role in your long term plan.
Your time horizon also shapes your decisions. When you have many years before you need the money, you can accept more movement in your portfolio. However, when your goals are closer, you may prefer investments that protect your savings. In addition, your comfort level matters. Some people can live with more ups and downs. Whereas, others prefer a smoother path, even if returns are smaller.
Understanding these ideas helps you compare investments with more confidence. In addition, it helps you see which choices offer the best risk to reward ratio for your goals. As you move forward, concepts like diversification and asset allocation help you combine different investments so you can balance growth, stability, and your own comfort with risk.
References and Further Reading
[1] U.S. Securities and Exchange Commission. “Risk and return“
[2] Texas State Securities Board. “Risk & Return: You Can’t Have One Without the Other”
[3] US Securities and Exchange Commission. “Assessing Your Risk Tolerance”
[4] US Securities and Exchange Commission. “What is Risk?”
FAQ Risk vs Return
Risk and return move together. Higher potential return usually comes with more uncertainty. While, lower risk choices tend to grow more slowly. As you compare investments, you see how each one fits into your own risk vs return balance. Therefore, this helps you decide which choices offer the best risk to reward ratio for your goals and your time horizon.
Your time horizon shapes how much movement you can accept in your portfolio. When you have many years before you need the money, you can wait through market swings and focus more on growth. However, as your goals get closer, you may shift toward investments that protect your savings and reduce short‑term volatility. As a result, this shift helps you match your comfort level with the amount of risk you take.
Diversification spreads your money across different investments so one setback does not affect your entire portfolio. As a result, when one investment falls in value, others may rise or stay stable. This mix reduces nonsystemic risk and creates a smoother path toward your long term goals. Therefore, as your portfolio becomes more diversified, you rely less on the performance of any single investment and more on the overall balance of risk vs return.
Volatility shows how often and how sharply an investment’s price moves. Some investments change price quickly, while others move more slowly. Volatility affects short term results the most. However, over longer periods these ups and downs often even out. Therfore, when you understand how volatile an investment is, you can choose options that match your comfort level, your time horizon, and the risk to reward ratio you want to achieve.
Recent Market Concepts Articles and Guides
-
How Diversification Reduces Risk in Investing
Diversification helps investors manage uncertainty by spreading exposure across different investments instead of depending on a single one to carry all the risk. This approach reduces the…
-
How Financial Markets Work
Financial markets are places or systems where buyers and sellers trade financial instruments such as bonds, equities, currencies, and derivatives. These markets connect people who need capital…
Latest Free Market Concepts Tools You Can Download
-
Business Loan Affordability Calculator for Commercial and Industrial Property
This business loan affordability calculator is an Excel template that helps users test DSCR, compare repayments,…
-
Ratio Analysis Spreadsheet
A simple Excel spreadsheet that helps you calculate and understand key business financial ratios. Ideal for…
Online Calculators and Free Other Free Tools You Can Download
Explore these tools to run quick calculations, test ideas, and download resources that support your learning.
Disclaimer – Educational Use Only
Content on MoneyOpes.com is for informational and educational purposes only. It does not constitute financial, legal, or professional advice. Your financial situation is unique, and outcomes may differ. Past performance is not a guarantee of future results. MoneyOpes.com adheres to strict editorial integrity standards, and to the best of our knowledge, all content is accurate as of the date posted. See our full disclaimer.